Service Desk Software

Reports

Get the Information You Needs to be Make Critical Decisions

Help Desk Reporting

Know what is happening within your organization so you can make strong decisions. Reporting has become critical in today’s business environment. Organizations can make decisions based on Zinergy’s data gathering feature. But you need more than just the right data: you need perspective to drive change. We put as much emphasis on reporting as on any other feature.
Zinergy’s Help Desk Reports includes a Report Library containing more than 300 flexible, accurate report templates to give you the metrics you need. Zinergy will:
  1. Run reports automatically and email them on desired dates.
  2. Access almost any kind of data, with more than 35 data drivers as well as tight controls over database connectivity.
  3. Design professional looking, interactive reports with features like the visual report designer and dynamic prompts.
  4. Customizing reports to match your company’s needs.
  5. Give access to team members to view and work with reports.
  6. Work within your existing security infrastructure.
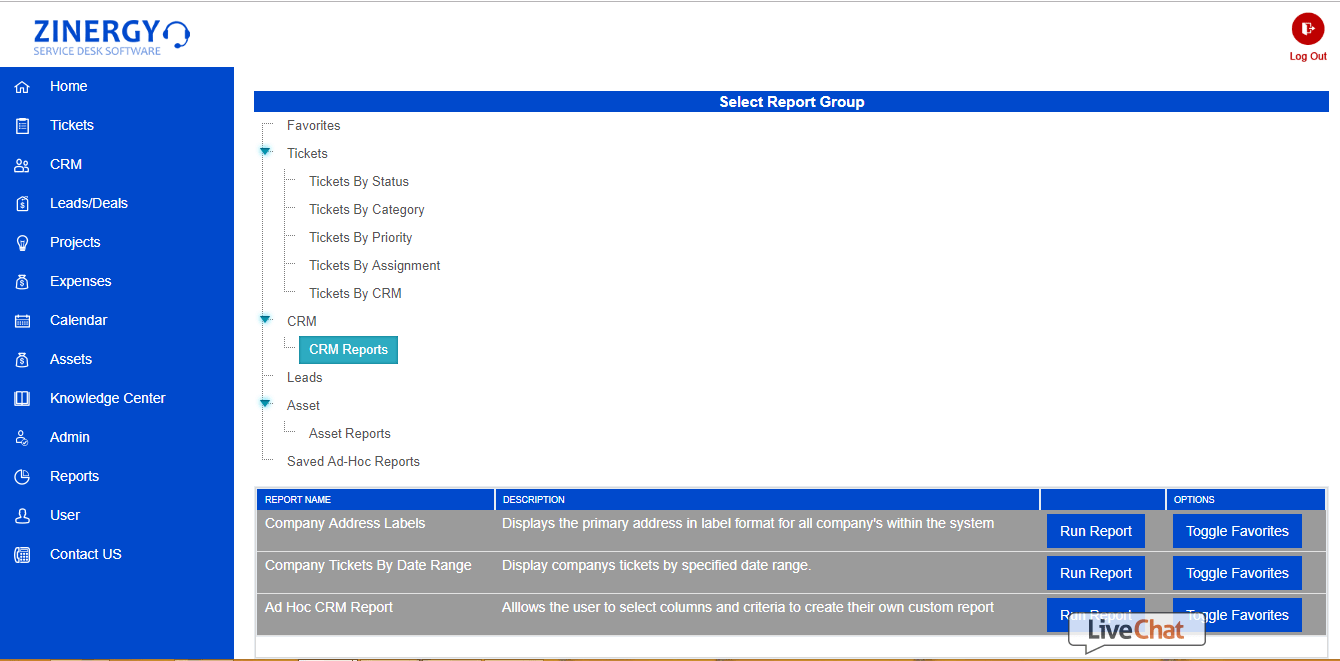
Reporting often provides the big-picture perspective that reveals the “real issues” underlying user needs. Reports lets you view every type of customer interaction organize and reassemble the metrics and make strong decisions moving forward. You can analyze response times, backlogs, agent activity, and customer satisfaction. Zinergy Help Desk provides the database you needs to be track and report, ultimately saving you time and money.
Zinergy’s report templates were recently updated using Telerik Tools, a leading ASP.net, the world standard for enterprise reporting today. If you cannot find the report you need among our 300+ options, let us help you customize the reports you need.

Details on our new Telerik Tools Reports include:

  • NEW Report Interactivity (drill through reporting, navigate to a bookmark, navigate to URLs)
  • NEW Integration with Telerik OpenAccess ORM and ADO.NET Entity Framework with code-less design-time support
  • NEW Greatly improved layout rendering performance for the table items (crosstab, table, list)
  • Works equally well in Silverlight, WPF, Windows Forms and ASP.NET Ajax projects
  • Excellent data presentation and analysis: Crosstabs, Charts, Tables, Lists
  • Sub Reports, Barcodes, Images, Shapes, and more
  • Revolutionary WYSIWYG design surface in Visual Studio
  • Easy conditional formatting, sorting, filtering, grouping
  • Powerful styling, data binding and data processing models
  • Significantly reduced development time through wizards and builders
  • Report converters from Crystal Reports, XtraReports and Active Reports
  • Perfect positioning of elements in all supported formats